2.4 Lab Exercise: Voltage Dividers
Objectives
- Understand voltage and signal generation
- Understand voltage and signal measurement
- Become familiar with the instruments used for voltage and signal generation and measurement
- Become familiar with prototyping circuits
- Deepen understanding of voltage dividers
- Model real circuits
- Learn to acquire voltage measurements with the myRIO
- Learn to plot and export plots in Python
Materials
- PC with LabVIEW installed
- myRIO configured with LabVIEW
- Multimeter
- DC power supply
- Breadboard
- Jumper wires
- Resistors:
- two 1.5 MΩ
- one each of 2.2 MΩ, 3.3 MΩ, 4.7 MΩ
- Function generator
- Oscilloscope
- Two BNC cables
- One BNC Y- or T-connector
Building a Voltage Divider Circuit
- Measure and record the actual resistance of each resistor:
- Connect the two 1.5 MΩ resistors in series.
- Connect the DC power supply across the series resistors.
- Set the power supply to 10 V (see [@res:supplying-voltage]).
Measuring with a Multimeter
- Measure the voltage across each resistor:
- Measure the voltage across both resistors (source voltage):
- Record the voltage and current from the power supply front panel:
- Replace the output resistor \(R_2\) with 2.2 MΩ and repeat.
- Repeat for 3.3 MΩ and 4.7 MΩ.
Summary Table
Record \(\widetilde{R_i}\), \(\widetilde{V_s}\), and \(\widetilde{v_{R_i}}\) for each \(R_i\) in the table below:
myRIO Measurements
- Build the original divider with two 1.5 MΩ resistors; do not power it yet.
- Connect the myRIO to power and USB.
- Use MSP connector C (figure 1).

Connect:
- AGND (3) to circuit ground
- AO1 (5) to other end of series resistors
- AGND (6) and AI0- (8) to ground
- AI0+ (7) to node between resistors (output node)
Download and extract Lab Stubs to the PC.
Open Lab 02 project and implement:
- AO0 output controlled from front panel
- AI0+ measured continuously
- Both voltages plotted on same chart
- Digital readouts of current values
The front panel and block diagram should look something like what are shown in figure 2 and figure 3, respectively.
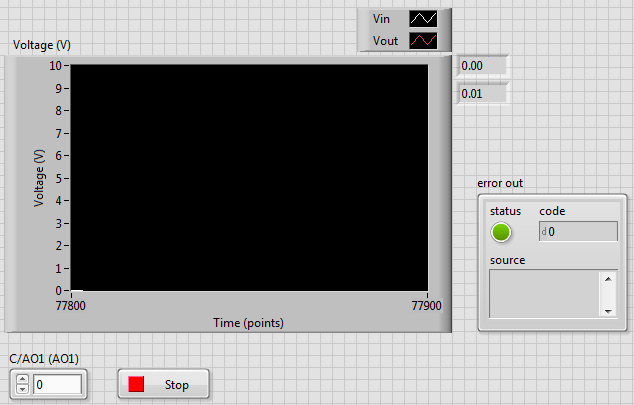
Figure 2: Example front panel 
Figure 3: Example block diagram Sweep \(V_s\) from 0 to 10 V and record measured outputs.
Repeat for each output resistor: 2.2 MΩ, 3.3 MΩ, 4.7 MΩ.
Summary Table
Signals from the Function Generator
- Set the function generator:
- Waveform: sine
- Frequency: 10 kHz
- Amplitude: 5 Vpp
- Connect OUTPUT to oscilloscope CH1. Confirm:
- AC coupling
- Vertical mode: CH1 or DUAL
- Trigger: AUTO and CH1
- Probe setting: 1X
- Adjust oscilloscope for stable waveform.
- Record:
- Switch waveform to square, triangle, sawtooth, then back to sine.
- Set frequency to 10 Hz.
- Adjust TIME/DIV to observe waveform sweep.
- Profit.
Report Requirements
Your report should include:
- Circuit analysis of each configuration using \(R_1\) and \(R_2\), modeling each source.
- Plot of multimeter measurements of input and output voltage vs. resistor value. Use marker-only plots (e.g., ×, ○) and add theoretical predictions as continuous lines.
- Plot of myRIO measurements: \(\widetilde{V_s}\) vs. \(\widetilde{v_{R_i}}\) for each \(R_i\), with theoretical predictions.
- Table of all multimeter measurements (resistance and voltage).
Photos taken during the lab may be included.