2.2 Lab Exercise: Calibration and Lumped-Parameter Estimation
Objectives
- Understand the importance of calibration in experimental setups.
- Learn how to calibrate temperature sensors.
- Analyze the effects of calibration on experimental results.
- Understand the limitations of calibration techniques.
Equipment and Materials
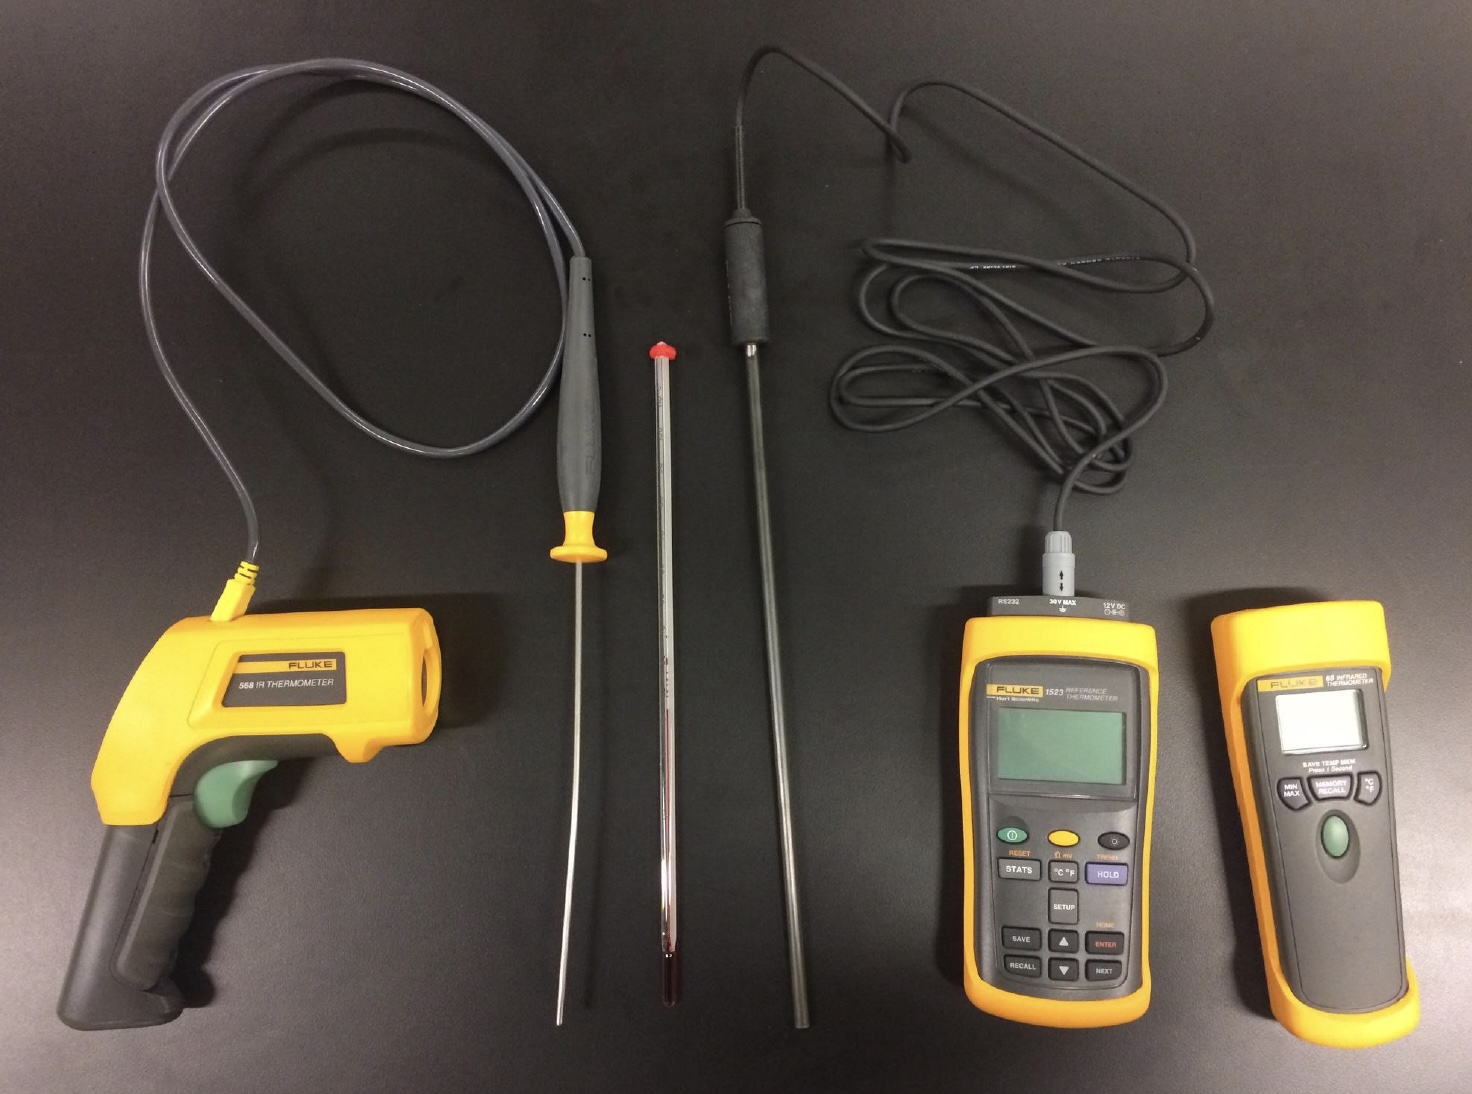
- Infrared temperature probe Fluke 568
- K type thermocouple probe for use with the Fluke 568
- Platinum resistance thermocouple with reference thermometer Fluke 1523
- Infrared temperature probe Fluke 65
- Alcohol thermometer
- Barometer Pinco 469
- Hot plate
- Distilled water
- Beaker
The figure below shows the temperature measurement devices:
Procedure
Calibration
In the following steps, you will calibrate the temperature sensors.
- Fill beaker with distilled water and record the initial temperature and volume. Make the temperature measurement with the Fluke 1523 reference thermometer.
- Set beaker on hotplate (turned off)
- Read the atmospheric pressure with the Pinco barometer on wall. In your analysis, you will use the user manual for the barometer to apply the necessary corrections to estimate the saturation (boiling) temperature for water at that pressure.
- Place both probes and the alcohol thermometer in the beaker on the hot plate. Be sure that the probes and thermometer do not touch the side of the beaker and that the bulb of the alcohol thermometer is fully submerged. Set up the 568 infrared thermometer so that it is pointing directly at the side of the beaker.
- Check the settings on the 568 to ensure that you are reading in degrees C and that the proper emissivity for the materials you will be measuring is selected. This will change based on if you are sampling temperature through the glass or directly into the water.
- Turn hotplate on high setting and wait for the water to boil (steady-state).
- Take 6 sets of readings. One set is one reading from each device, taken simultaneously. Have a timekeeper say "3, 2, 1, mark," while 4 others take readings to ensure all readings are taken at the same time. The 7 readings are:
- Alcohol thermometer
- Fluke 1523 reference thermometer
- K-type thermocouple probe connected to the Fluke 568
- Fluke 568 infrared thermometer through air/glass
- Fluke 568 infrared thermometer through air
- Fluke 65 infrared thermometer through air/glass
- Fluke 65 infrared thermometer through air
- Enter data into JSON file or spreadsheet for later analysis.
Cooling
- Once the sensors have been calibrated at the boiling point, take a final set of readings just as someone turns off the hot plate.
- Take additional sets of readings as the water cools, synchronized at intervals of 2 minutes until the temperature drops below 50 degrees C.
- Enter data into JSON file or spreadsheet for later analysis.
Lab Report Questions and Required Analysis
Within the normal sections of the report, please include the following:
- Use the barometer user manual to correct the barometer reading \(P\). Use this to estimate the saturation boiling temperature \(T_{\text{sat}}\) for water at pressure \(P\). You may interpolate from Bergman, Lavine, and Incropera, 2019, Table A.6 or use an approximation formula such as those found in (Unknown, 2025).
- A plot of calibration readings for all temperature measurement devices. Set numbers go on the x-axis. Temperatures go on the y-axis. Each temperature device have its own connected series.
- Again for your calibration readings, a plot of the difference between each temperature measurement device and the boiling temperature calculated from the atmospheric pressure.
- An analysis of which type of temperature measurement is the most accurate.
- A calibration constant for each type of temperature measurement device that can be used to correct measurements.
- Use the calibration constants to correct the cooling data. Plot the corrected temperature measurements for all devices on one plot.
- Estimate the cooling time constant \(\tau\) for the beaker of water by performing a regression on the cooling data. Fit to the curve \[ T(t) = T_{\infty} + (T_0 - T_{\infty}) e^{-t/\tau} \] where \(T_{\infty}\) is the ambient temperature and \(T_0\) is the initial temperature (at time \(t=0\), the boiling point). Note that a linear regression on the logarithm of the temperature difference may be appropriate. Use your best temperature measurement device's data for this analysis.
- From the initial temperature and volume of the water, estimate its initial mass \(m\).
- From the mass \(m\) and the specific heat capacity \(c\) of water, estimate the thermal capacitance \(C\).
- Estimate the thermal resistance \(R\) from the time constant \(\tau\) and thermal capacitance \(C\) using the relationship \(\tau = R C\). The units of \(R\) are \(\mathrm{K/W}\) and \(R\) is related to temperature \(T\) and heat transfer rate \(\dot{q}\) by the equation \[R = T / \dot{q}.\]
- Plot the fit of the cooling data with the original (corrected) data on the same graph for comparison.
- During cooling, why do the corrected temperature measurements wander away from each other?
Bibliography
- [BLI] Bergman, T. L., Adrienne Lavine, and Frank P. Incropera. Fundamentals of Heat and Mass Transfer. John Wiley & Sons, Inc..
- Unknown. "Vapour pressure of water". https://en.wikipedia.org/w/index.php?title=Vapour_pressure_of_water&oldid=1307464410